Data Analytics Simplified
Automate Smarter. Scale Faster.
Welcome to Data Analytics Simplified, a blog dedicated to helping you streamline data workflows, automate processes, and scale your infrastructure—without the headaches. Whether you’re battling messy spreadsheets, inefficient pipelines, or trying to get the most out of your data analytics investments, you’re in the right place.
Why You’re Here:
- Your Data Outgrew Your Infrastructure: Your setup worked for a while, but now it’s bursting at the seams. It’s time to upgrade, streamline, or rebuild entirely.
- Your Analytics Aren’t Delivering: You’ve invested in analytics tools and tech, but the results are underwhelming. You need insights, not excuses.
- You’re New to the World of Data: You’re navigating the complexities of data engineering for the first time and need practical, actionable advice to get started.
What You’ll Get:
I’ll share proven strategies, tips, and frameworks from my experience in data engineering and analytics, focusing on:
- Automation: Save time and reduce errors with automated workflows and processes.
- Operational Efficiency: Improve the scalability and reliability of your data infrastructure.
- Practical Problem-Solving: Explore innovative tools and technologies that get the job done efficiently and cost-effectively, without the need for overly complex or tailored solutions.
Data doesn’t have to be overwhelming. With the right approach, you can declutter, optimize, and build a solid foundation for data science and analytics.
Let’s get to work.
Recent Posts
-
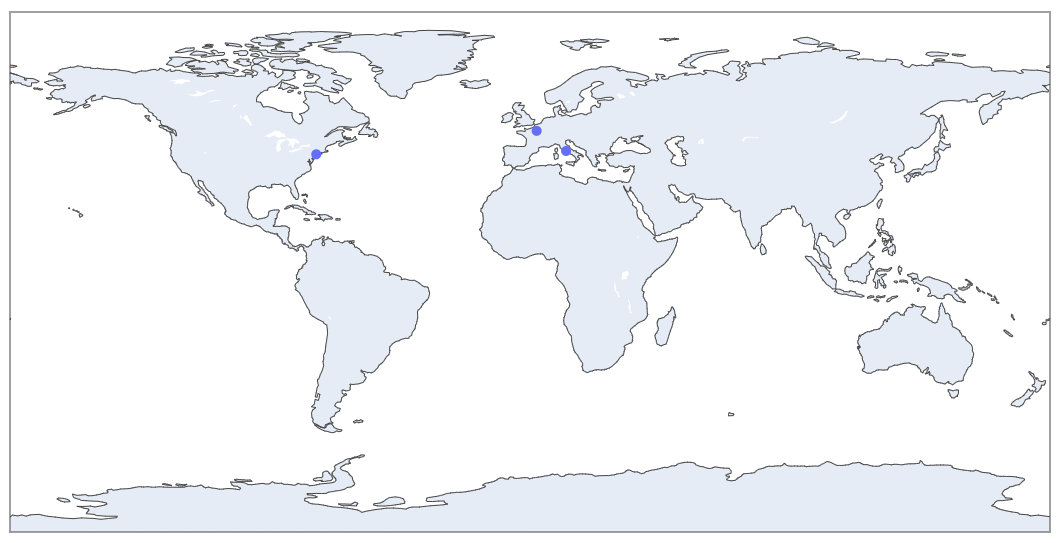
How to Return the Complete Address Information from a Place Name or Partial Address in Python
Leverage Google Maps API or Nominatim in Python to return complete address information that you can use for geo charts.
-
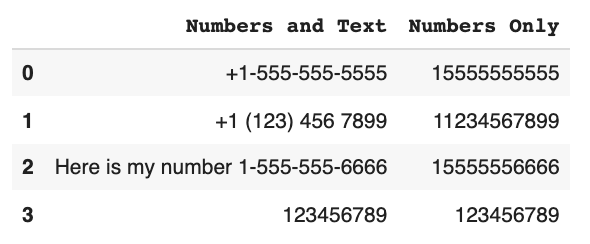
How to Extract all Numbers from a String Column in Python Pandas
In this post, I’ll show you how to extract every number from a string in Python using regular expressions.
-
Tips to View your Entire DataFrame in a Jupyter Notebook
The default print view for a Pandas DataFrame can be limiting for larger datasets and can get in the way of a thorough review of the data.
-
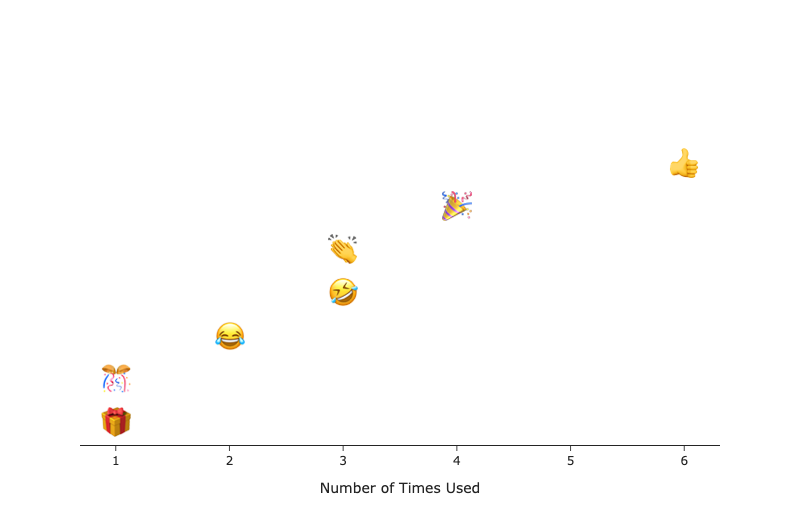
Extract Emojis from Python Strings and Chart Frequency using Spacy, Pandas, and Plotly
In this post, I’ll show you how to extract emojis from a string in Python, count the frequency, then plot them using Plotly.
-
How to Set a Timezone for a Datetime Object in Python
In this post, I’ll show you how to add a timezone to a naive Datetime object.
-
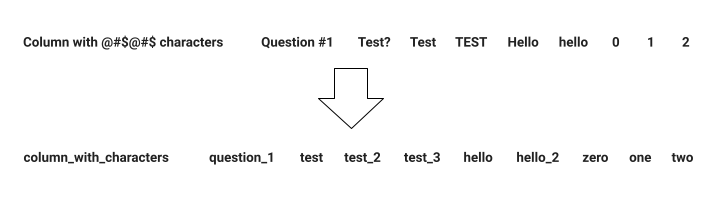
How to Convert your Pandas Columns for a Structured Database like SQL
Python Pandas allows for a lot of flexibility when naming your which can cause trouble if you are trying to import the data into a structured database like SQL or BigQuery. In this post, I’ll show you how to format your Pandas columns to make them compliant with structured databases.
-
How to Easily Scrape HTML Tables from a Website with Python Pandas
Pandas has a function pd.read_html() to get an HTML table from a website in one line of code.
-

Why I Prefer Using Google Colab over Jupyter Lab for Data Science
Google Colab is Google’s version of a Jupyter Notebook and takes advantage of the same features you find in other Google Apps to make Python coding easy.
-

How to Export all Tickets from Zendesk using the API and Python
In this post, I’ll walk you through exporting tickets, users, and organizations from Zendesk using the API and Python for data analysis.