In this post, I’ll show you how to extract emojis from a string in Python, count the frequency, then plot them using Plotly.
The Chart
Steps Overview
- Setup and import spaCy and spacymoji
- Convert strings to a Pandas DataFrame
- Extract Emojis from each string
- Count the frequency of each Emoji
- Plot Emojies using Plotly
Setup and import spaCy and spacymoji
The first thing we will do is set up SpaCy which is a natural language processing library for Python. In addition to setting up spaCy, we also have to set up the spacymoji extension to help identify Emojis in our strings. Here is what you can run in Google Colab to get this setup:
!pip install -U pip setuptools wheel
!pip install -U spacy
!python -m spacy download en_core_web_sm
!pip install spacymoji

import spacy
from spacymoji import Emoji

nlp = spacy.load("en_core_web_sm")
emoji = Emoji(nlp)
nlp.add_pipe("emoji", first=True)

nlp.pipe_names
Convert strings to a Pandas DataFrame
Let’s start with a list of strings that contain emojis:
text = ['Hey check this out 👍👍👍👍👍👍',
        'Happy Birthday 🎉🎉🎉🎉🎊🎁',
        'That is so funny 😂😂🤣🤣🤣',
        '👏👏👏']
We will convert the list of strings to a Pandas DataFrame by running pd.DataFrame.
df = pd.DataFrame(text, columns=['text'])
df

Extract Emojis from each string
To extract Emojis from each string, we first call the nlp object. Then we can create a for loop to return an emoji token only.
The final result is a DataFrame with a list of Emojis in each string.
def extract_emojies(x):
  doc = nlp(x['text']) #with emojis
  emojis = [token.text for token in doc if token._.is_emoji]

  return emojis

emojies_df = df.apply(extract_emojies,axis=1)
emojies_df

Count the frequeny of each Emoji
Now that we have isolated each Emoji, we can count up the frequency. Here’s how we can do that:
.apply(pd.Series)to break up the list into seperate columns.stack()will collapse each column into one column.value_counts()is a handy function that returns a frequency of each item in the column
emoji_counts = (emojies_df
                .apply(pd.Series) #breaks up the list into seperate columns
                .stack() #collapses each column into one column
                .value_counts() #counts the frequency of each item
                .rename('Count')
                .sort_values()
                .reset_index()
                .rename(columns={'index':'Emoji'}))
emoji_counts
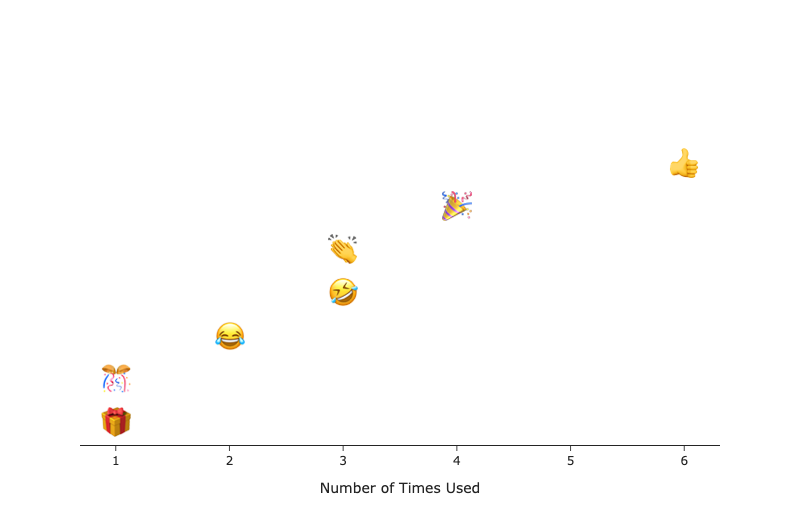
Plot Emojies using Plotly
Finally, we can plot the DataFrame using Plotly.
The trick here is that we can use the actual Emoji as the marker by referencing the Emoji column in the text argument in Plotly. text=emoji_counts['Emoji'].
import plotly.graph_objects as go
import plotly.io as pio
import plotly.express as px
import plotly

fig = go.Figure()

fig.add_trace(go.Scatter(y=emoji_counts['Emoji'],
                x=emoji_counts['Count'],
                name='Emoji Counts',
                marker_color='white',
                orientation='h',
                text=emoji_counts['Emoji'],
                textposition='top center',
                mode='markers+text',
                textfont=dict(size=30),
                ))

fig.update_yaxes(visible =False, range=[0, len(emoji_counts)+1])
fig.update_xaxes(title='Number of Times Used')

fig.update_layout(
    template='simple_white',
    height=len(emoji_counts)*75, width = 800)
Final Thoughts
Check out more Python tricks in this Colab Notebook or in my recent Python Posts.
Thanks for reading!