Data Analytics Simplified
Automate Smarter. Scale Faster.
Welcome to Data Analytics Simplified, a blog dedicated to helping you streamline data workflows, automate processes, and scale your infrastructure—without the headaches. Whether you’re battling messy spreadsheets, inefficient pipelines, or trying to get the most out of your data analytics investments, you’re in the right place.
Why You’re Here:
- Your Data Outgrew Your Infrastructure: Your setup worked for a while, but now it’s bursting at the seams. It’s time to upgrade, streamline, or rebuild entirely.
- Your Analytics Aren’t Delivering: You’ve invested in analytics tools and tech, but the results are underwhelming. You need insights, not excuses.
- You’re New to the World of Data: You’re navigating the complexities of data engineering for the first time and need practical, actionable advice to get started.
What You’ll Get:
I’ll share proven strategies, tips, and frameworks from my experience in data engineering and analytics, focusing on:
- Automation: Save time and reduce errors with automated workflows and processes.
- Operational Efficiency: Improve the scalability and reliability of your data infrastructure.
- Practical Problem-Solving: Explore innovative tools and technologies that get the job done efficiently and cost-effectively, without the need for overly complex or tailored solutions.
Data doesn’t have to be overwhelming. With the right approach, you can declutter, optimize, and build a solid foundation for data science and analytics.
Let’s get to work.
Recent Posts
-
Deploy Your Next Flask App Instantly and for Free Using Replit
Replit is a free tool that makes it easy to write Flask code and deploy it instantly. They handle of all the underlying infrastructure, allowing you to focus on building and refining your app without worrying about setup and maintenance.
-
A Short Practical Guide to Window Functions in SQL
A window function allows you to concisely compare rows in a single table.
-
How to Convert a Seconds Column to Minutes and Hours in Pandas
In this post, I’ll walk through how to convert a Pandas column that is in seconds and convert it to a datetime or a formatted string.
-
Things to do – Flask app
This is a little Flask web app I made to get recommendations for things to do when traveling.
-
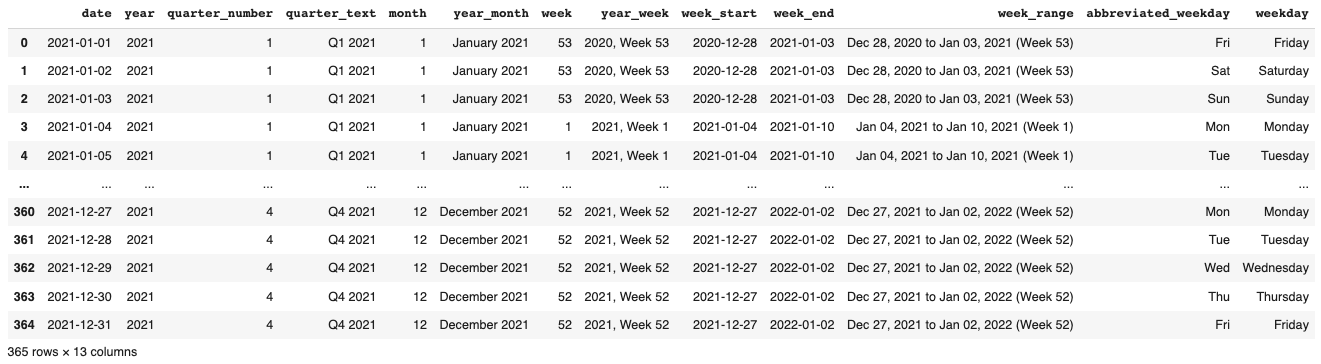
How to Dynamically Generate a Date Dimension Table using Python Pandas
The Pandas package in Python allows you to generate a list of dates dynamically and then extract their attributes with various datetime functions.
-
How to Dynamically Add new Rows to a Pandas DataFrame
This is a little trick I used to append new rows to a Pandas DataFrame. This method is similar to appending a new item to a list.
-
What is Data Engineering?
A Data Engineer’s primary focus is to assist companies in scaling their reporting capabilities beyond the limitations of spreadsheets. Automated systems are implemented to replace manual processes and import data from various sources, which is then transformed for easy visualization or use in data science models.
-
How to Dynamically Format Pandas DataFrame Columns to be Database and Parquet Ready
Pandas allow for almost anything as a column header and I’ll show you how to get your columns parquet and database ready.
-
How to Compare the Schema Between Two Pandas DataFrames
Having consistent schemas between two Pandas DataFrames is essential when saving to Parquet and for merging operations.